Read the Tape
Rate itFive hidden stock charts a day: call each one up or down.
on readthetape.cc
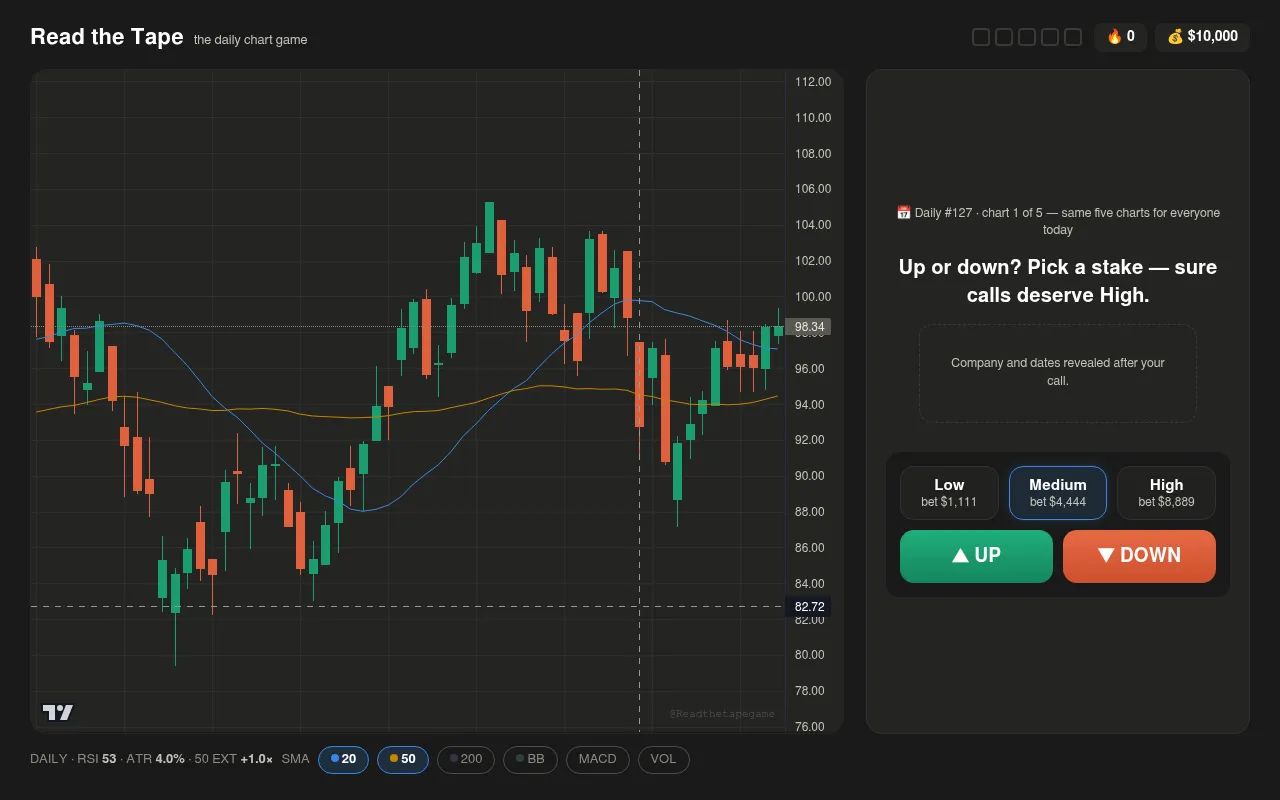
Read the Tape is a daily chart-reading game. Each day deals five real S&P 500 charts with the ticker and dates hidden, and you call whether each will be up or down over the next five sessions, staking Low, Medium or High from a paper bankroll. Your day is scored against a random Monkey Index, and calls also count toward twenty-day seasons scored on calibration.
About Read the Tape
Read the Tape deals five charts at midnight UTC, and every player gets the same five. Each is a real historical chart of an S&P 500 stock: sixty daily candles with the company's ticker, the dates and the five trading sessions that followed all hidden. The first daily went out on 5 July 2026, and the one on 8 November 2026 was #127.
For each chart you call "UP" or "DOWN" for the next five sessions and choose how much to stake. Low, Medium and High are set bets from a $10,000 paper bankroll (on 8 November they were $1,111, $4,444 and $8,889). The chart has 20, 50 and 200 day moving averages, Bollinger bands, MACD and volume you can switch on and off, with RSI and ATR readings beneath it. After the call the hidden sessions are drawn in, the company is named, and your result is settled next to the Monkey Index, eleven seeded random callers that make the same calls for everyone that day.
After five charts you get a day's P&L to share as a row of coloured squares, a streak counter, and a challenge link to send to a friend or a group. A dated recap page for each settled daily names the five stocks with the crowd's split. Calls also feed twenty-day seasons scored by Brier score on how well your confidence matched the results, with an honours board on the seasons page. Entry is free with no sign-up, and the bankroll never turns into real money. We saw no ads.
The maker, who describes the project as a team of one, also publishes reports on the crowd's calls and tests of classic chart patterns against the tape. It suits anyone curious whether they can read a price chart, from market followers to players who enjoy calibrated guessing.
How to play Read the Tape
- Press "Attempt alpha generation" to open the day's first hidden chart.
- Read the chart, switching the moving averages, Bollinger bands, MACD and volume on or off as you like.
- Pick a stake: Low, Medium or High.
- Call "UP" or "DOWN" for the next five sessions.
- See the real outcome and the stock's name, then press Next for the following chart.
- After five charts, compare your P&L with the Monkey Index and share it or challenge a friend.
Screenshots
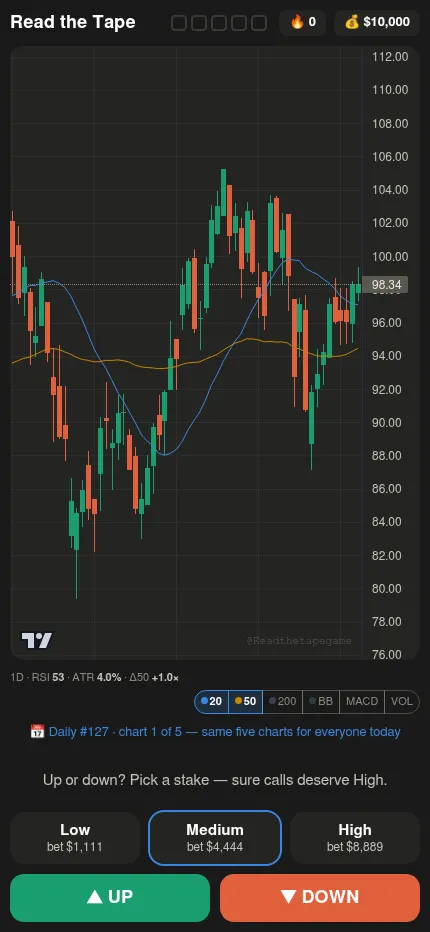

Tips
- Stake Low when a chart could go either way; a confident miss costs more than a cautious one.
- Look at the trend and the last few candles rather than one big move.
- Check the Monkey Index: beating random calls is the first goal.
Questions
Are the charts real?
Yes, real historical S&P 500 charts with the ticker and dates hidden until you call.
When are new charts dealt?
Every day at midnight UTC.
Is real money involved?
No. The bankroll is paper, and the game is free with no sign-up.
What are seasons?
Twenty-day windows in which every desk with three finished sessions is scored on calibration by Brier score. Awards go on the seasons page, and entry is free.
Ratings and reviews
Games like Read the Tape
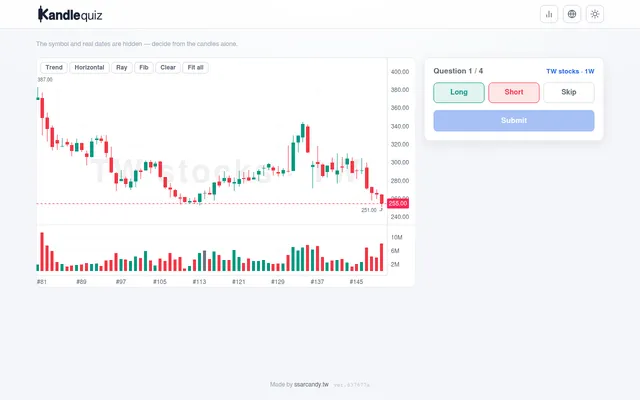
kandlequiz
Four hidden real candlestick charts a day, from US and Taiwan stocks or crypto, with one attempt at each call
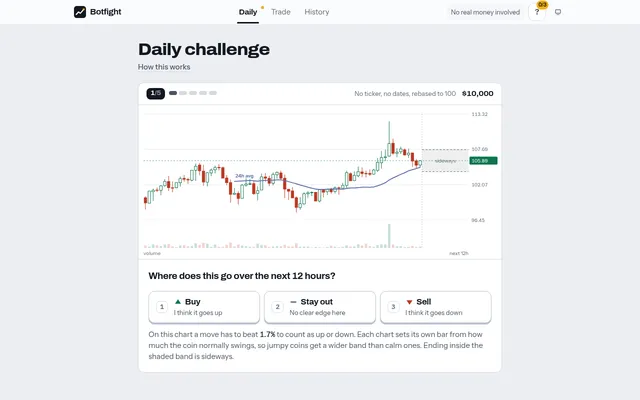
Botfight Daily
The same blind-chart idea for crypto. Five coins a day, and you call Buy, Stay out or Sell
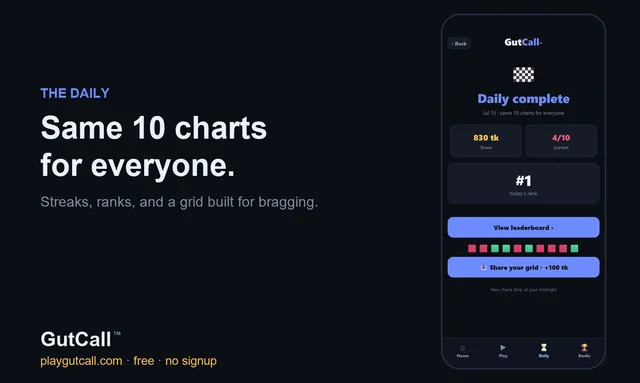
GutCall
Ten hidden historical price charts daily on a shared leaderboard
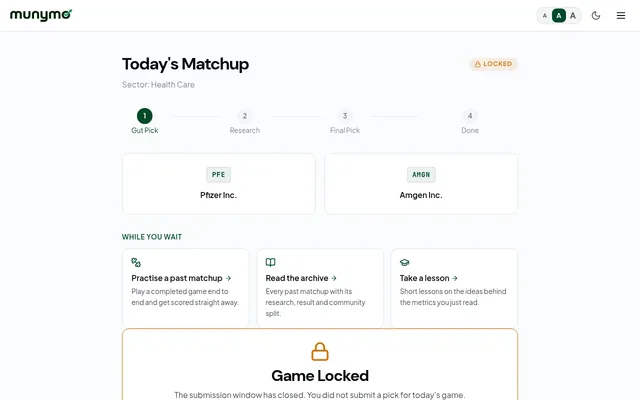
Munymo
Each US trading day pairs two companies from one sector, and you pick which stock does better
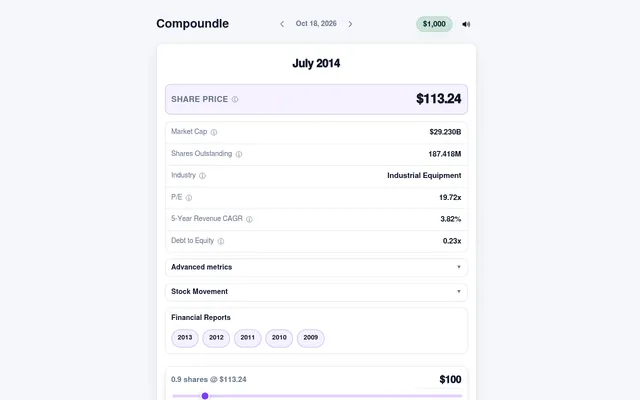
Compoundle
Invest, short or pass on a real company at a moment in its past, judged from its financial clues instead of a…
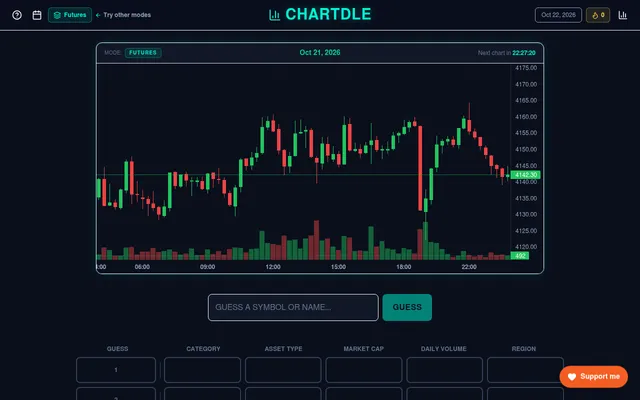
Chartdle
Here the chart is the clue to a name: guess the ticker behind three mystery charts
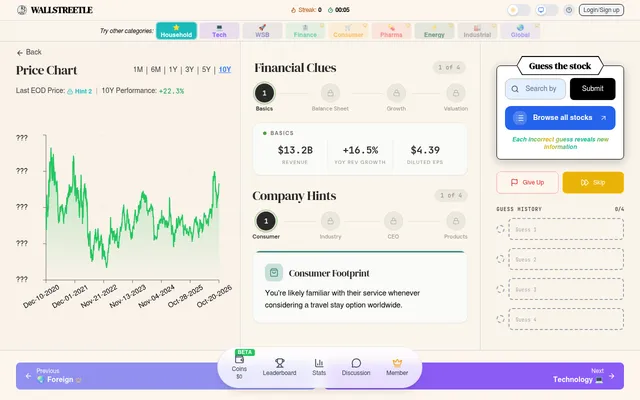
Wallstreetle
Name a stock of the day from its chart and figures
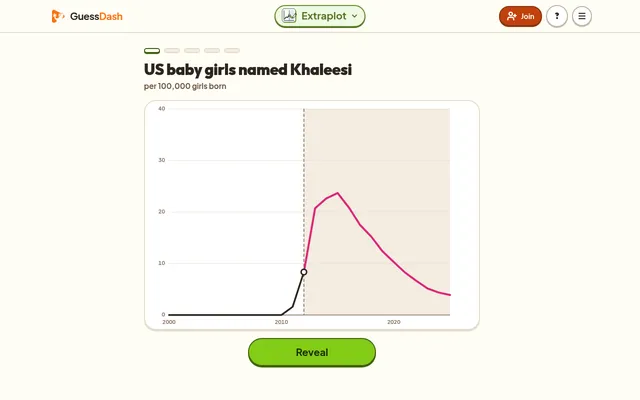
Extraplot (GuessDash)
For forecasting outside markets, draw where five real data charts went after their cut-off year