Trendraw (GuessDash)
See a real chart up to a cut-off year, draw where the line went, then watch the real one ink in.
Every day: A daily set of five real data charts, the same for everyone, each cut off at a year for you to draw the rest. New puzzle: Once a day (the GuessDash home page counts down to the next set of games).
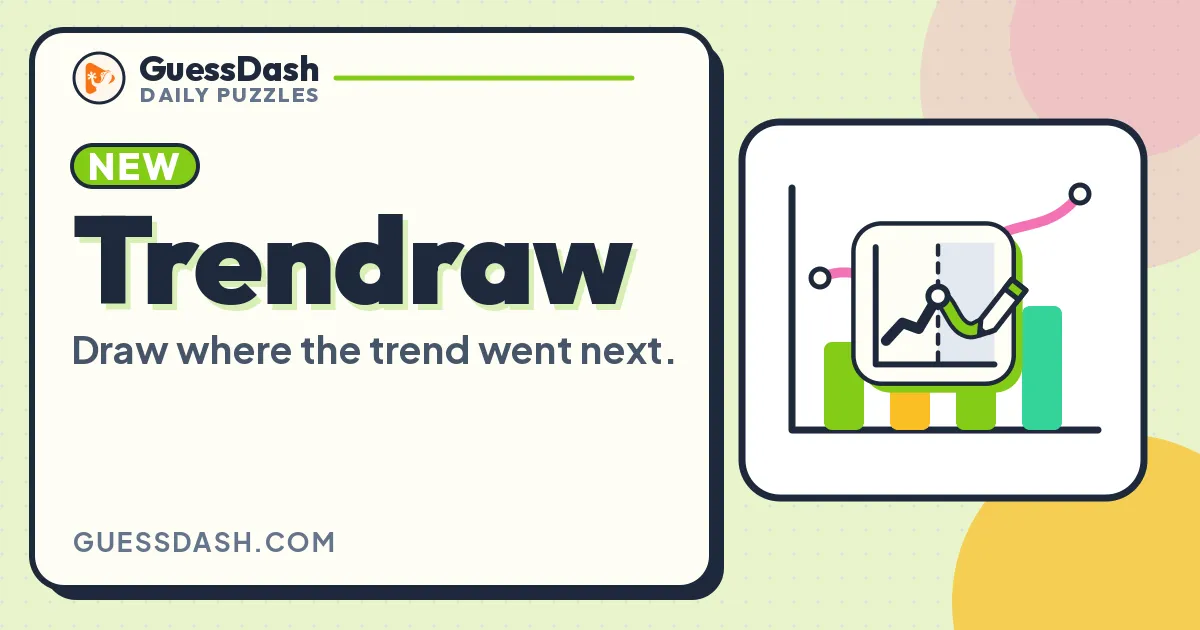
Trendraw is a daily data game on GuessDash. Each chart shows a real statistic up to a dashed cut-off, you sketch how you think it continued, and the closer your line is to the real one, the more points you score.
About Trendraw (GuessDash)
Trendraw is one of the daily puzzles on GuessDash, a site of free guessing games about geography, history, art and data. Each day brings a short run of real charts, the same for every player: one day might ask how often books mentioned the atomic bomb after 1949, how many US baby girls were named Alexa, or how many earthquakes Oklahoma recorded.
Every chart shows the real line up to a dashed cut-off year, with the unit given above it. You drag across the shaded part of the chart to draw where you think the line went, year by year, until the final year marked on the chart. Keyboard players can pick years with the left and right arrows and set values with up and down.
When you submit, the real line inks in over yours and a short note explains what happened. The smaller the gap between your guess and the truth, the higher your score.
It suits people who like charts, history and news, and anyone who enjoys finding out how good their instincts about real trends are.
How to play Trendraw (GuessDash)
- Open Trendraw on GuessDash to get today's charts.
- Read the chart title, unit and the dashed cut-off year.
- Drag across the shaded area to draw where you think the line went, up to the final year.
- Submit and watch the real line ink in over yours.
- Move on to the next chart and add up your score for the day.
Tips
- Think about what happened in the world after the cut-off year, such as a war ending, a new technology or a law change.
- Mind the unit and the scale on the axis before you draw.
- Big spikes and crashes are common in real data, so do not always draw a smooth line.
Questions
Is Trendraw the same for everyone?
Yes, the daily mode serves the same set of charts to every player that day.
How is it scored?
By how close your drawn line is to the real one: the smaller the gap, the more points.
Do I need an account?
No, you can play without one; signing up is optional.
Can I play with a keyboard?
Yes. Left and right arrows pick a year, up and down set its value.
Games like Trendraw (GuessDash)
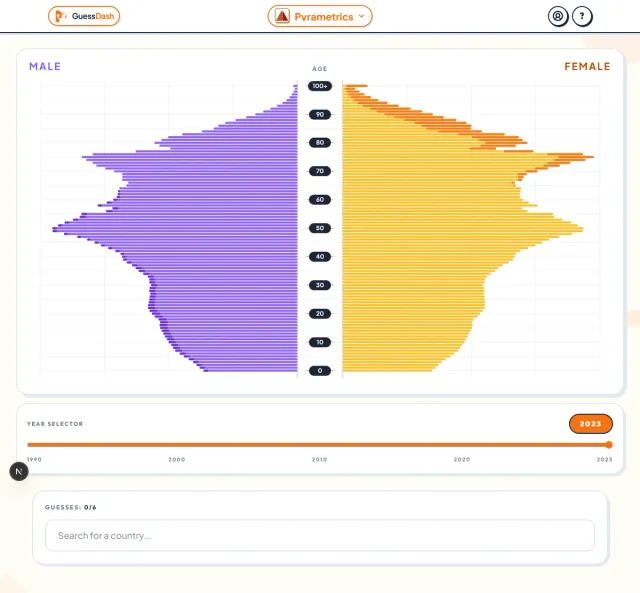
Pyrametrics (GuessDash)
A GuessDash sibling: name the country from its population pyramid chart.
Nationalysis (GuessDash)
A GuessDash sibling: buy data charts to name a mystery country.

Piecemeal (GuessDash)
A GuessDash sibling: drag slices to guess how real data splits.
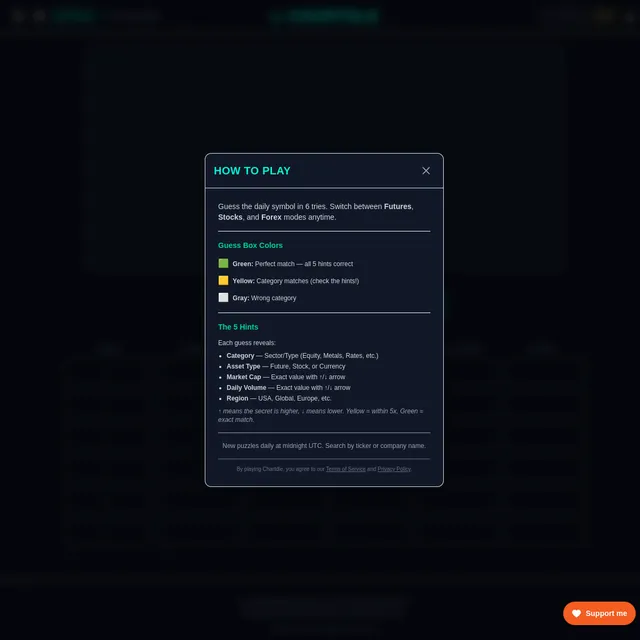
Chartdle
Name the stock or currency from its price chart.
Chartle
Name the country drawn on today's data chart.
Breakdown
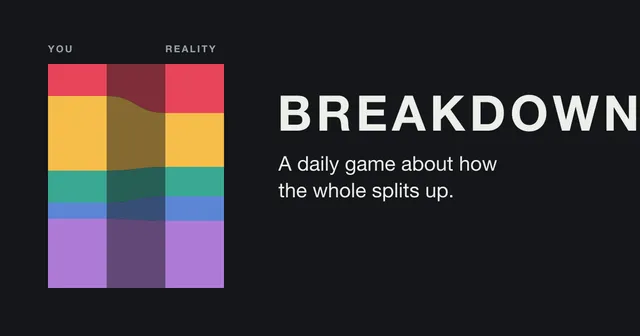
Guess how a real total splits, then see the true shares.
Fermidle
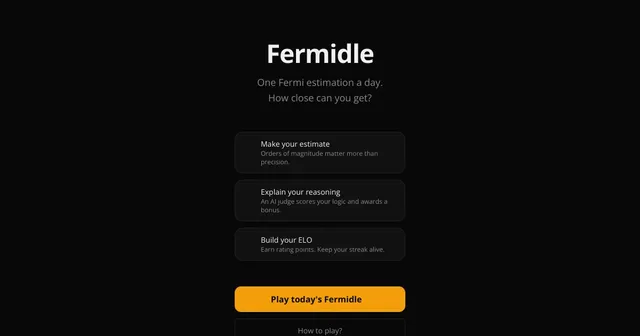
One Fermi question a day, one guess, scored by how many orders of magnitude you are off.
Fermle
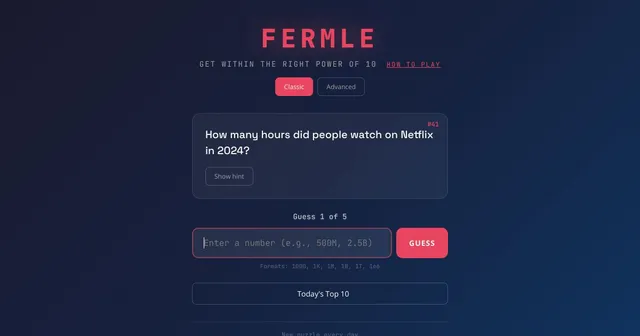
Guess the right power of ten for one hard-to-know number a day, in five tries.